Datarepública
Year: 2019
Design: Cepei & Show 'n Tell Data
Technologies: PHP, MySQL, Laravel, D3.js, Vue.js
Cepei is a Think Tank, located in Bogota, Colombia, that promotes the dialogue and multi-stakeholder participation in global agendas on sustainable development. As part of their work, they made a list of open datasets related to the Sustainable Development Goals (SDGs) available to anyone who is interested in it. They used to have this up on a static site Datarepública, where the data was loaded from a .csv file, but they needed something was centrally organized and that could continually be updated.
Requirements
- Create an easy and fun way to obtain info and the availability of open datasets related to the different SDGs in Colombia, Mexico and Costa Rica.
- Have a place where the Cepei can publish stories with data using Tableau embeds and the data from the different open datasets available on the website.
- Have a repository of news and events organized by the Cepei related to open data and SDGs
- Have a repository of on-line course offerings about the use of data and SDGs
This project is a very big one, and I won’t go into detail regarding all the features, but here are some of the more interesting solutions I developed for this project.
Database Design
The first issue to solve was the fact that all the data was originally stored in an .xlsx file and while they tried to keep the data clean and standardized, errors eventually crept into the formatting of the data in the table. As a result, my first job was to design a database in which all the data could be centrally stored and where all the formatting for the data was pre-set. Though the database design was nothing particularly complicated, it did have to take into account the possibilities for multilingual input as well as quite some different taxonomies in which the datasets were categorized. Eventually, all the data also had to be editable, meaning there needed to be a custom administration section where administrators could add and edit the data. Finally, the administrator was set up in such a way, that administrators can now upload datasets in bulk from a pre-formatted excel file.
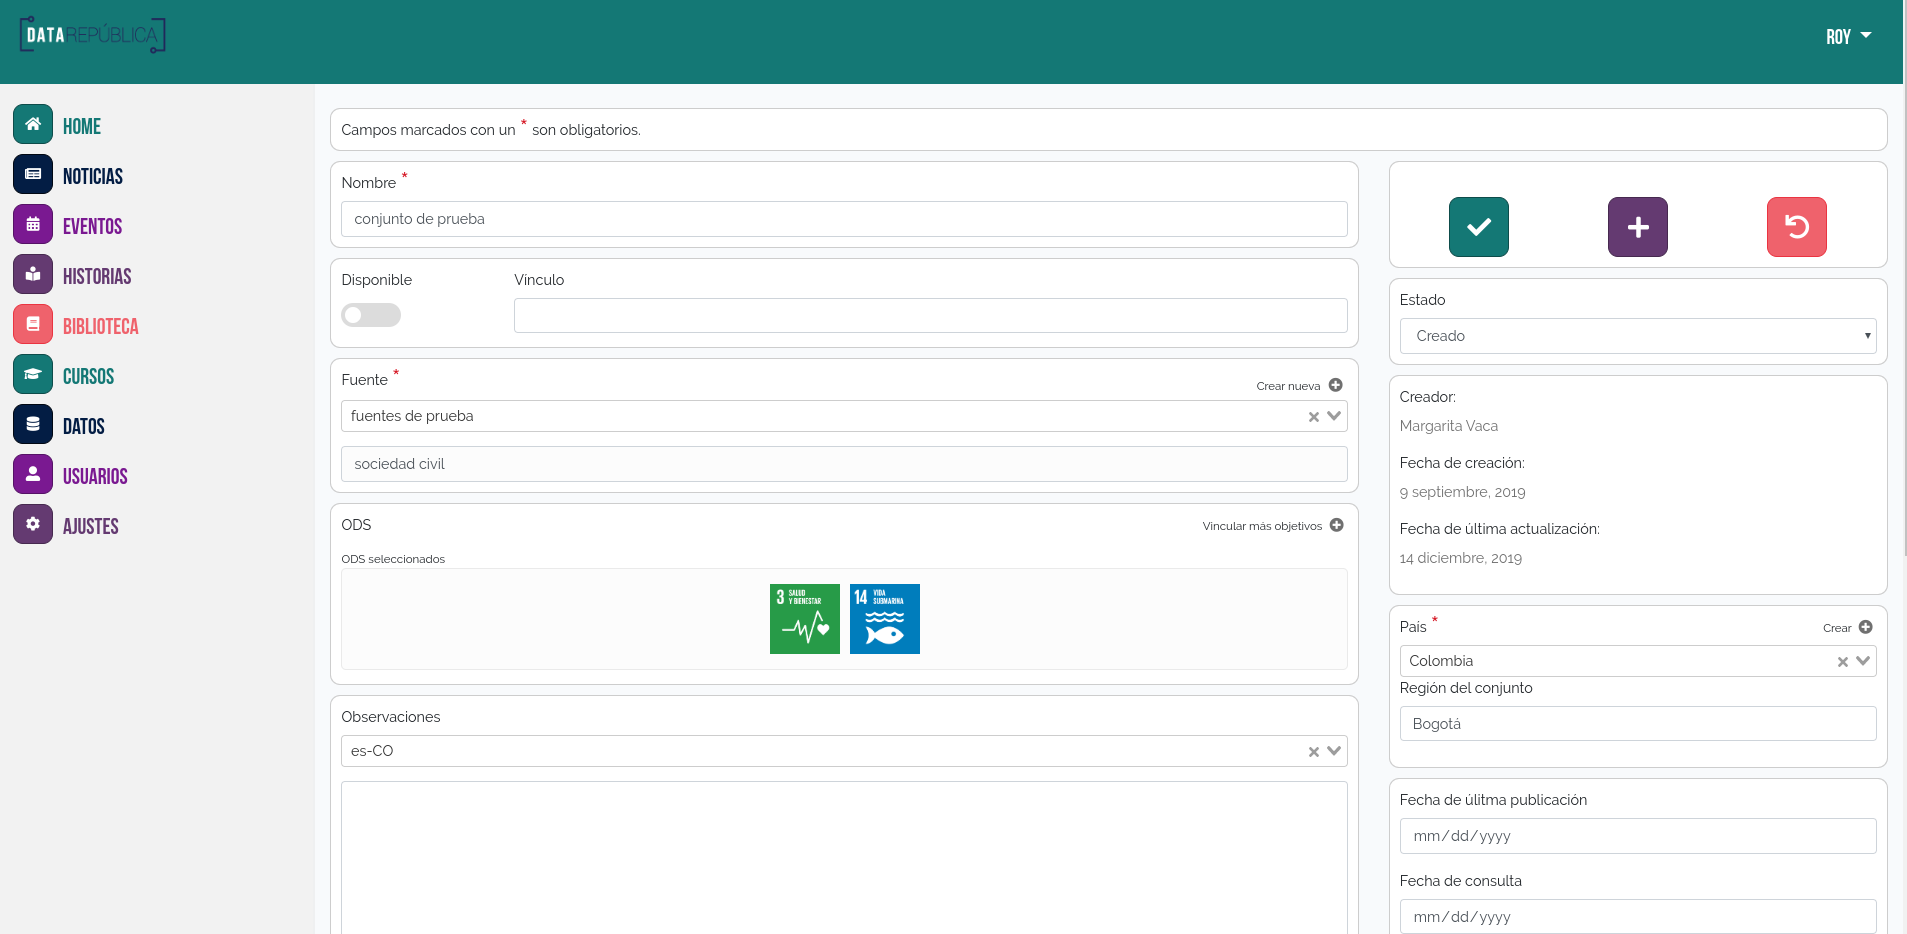 |
| The administrator view for editing a dataset |
The main data visualization
The original site, already had the network visualization, and Cepei wanted to keep this particular visualization in place. It is an interesting layout as it quickly shows the relationship between dataset, data source and SDG. However, the original visualization was done completely in SVG and could only show part of the data (about 300-400 nodes) in an efficient manner. Additionally, the position of all the nodes was almost hard coded into the visualization. On my first iteration I kept the SVG and let the processing of the data (and positioning, which is now much more naturally related to the data itself) happen in a web worker. However, this did not give me the boost needed to show a fluidly moving network with about 1200 nodes in it. So, then, instead of using SVG I moved to display the network in a Canvas element. Though this made interacting with the network a bit more tricky, it dit result in a fluid network visualization on most devices.
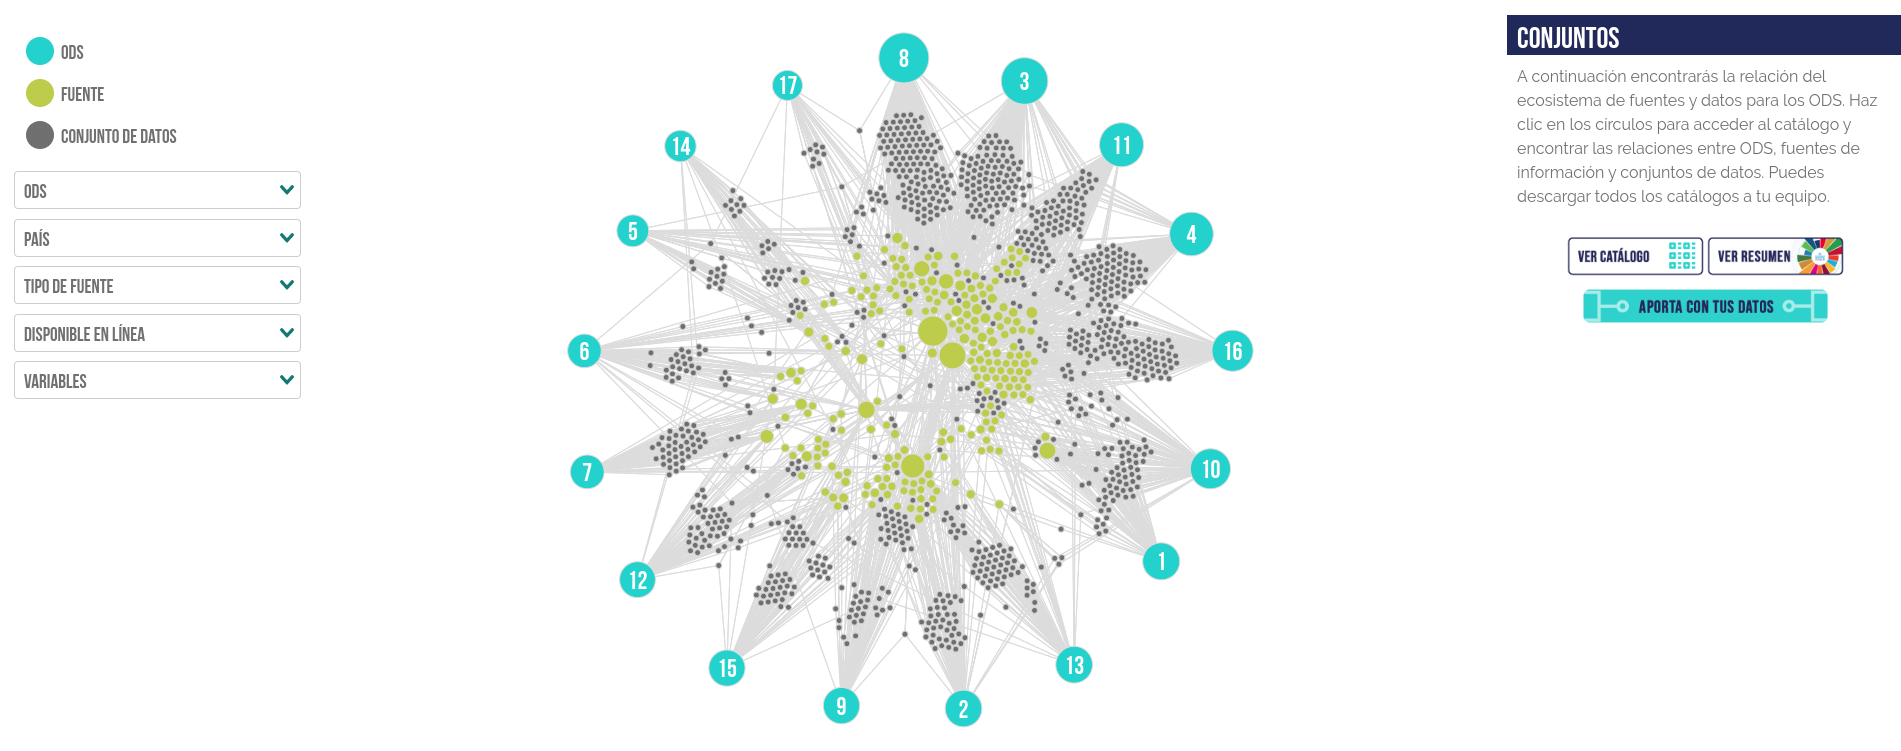 |
| The network in a canvas element |
An easy-to-use editor
Another new feature of the website was the possibility for any registered user to create data stories using the datasets available from the site and embedding data visualizations from Tableau into their stories. This meant that the text editor has to be easy enough to use without giving to many detailed options to change the layout of a story. So, with a little bit of inspiration from the Gutenberg blocks used by Wordpress, I developed a similar system which registered users the opportunity to create their own stories using blocks. One of these blocks is an embed block that can be used to insert embedded Tableau visualizations into their story.
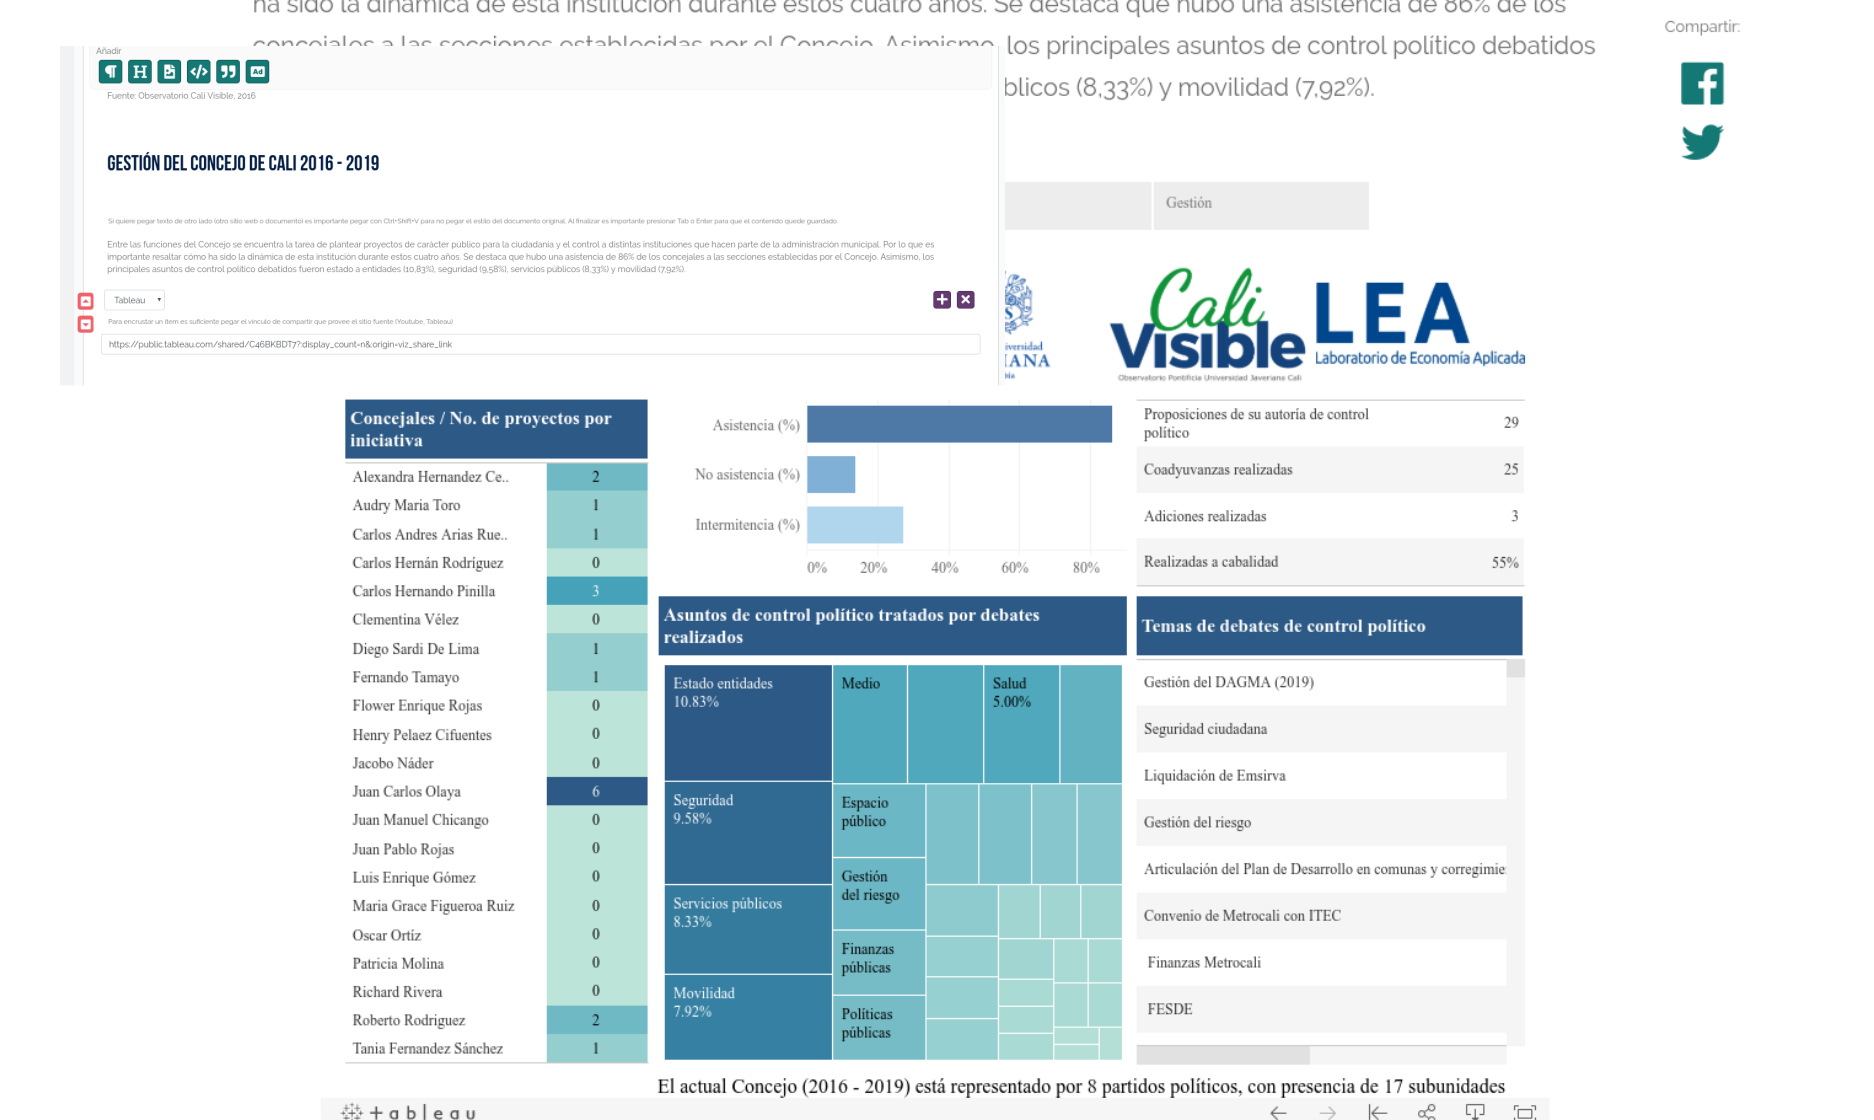 |
| An example of a story with data and embedded tableau viz as well as an excerpt of the story editor |