Ecologistics Handbook
Year: 2023
Design: Puntoaparte & Show 'n Tell Data
Technologies: Wordpress, Javascript
ICLEI is a global network of local and regional governments aimed at bringing sustainability to a rapidly developing urban world. Within their organization they have a focus on sustainable mobility and a project that is called EcoLogistics. This project focuses on sustainable urban freight. Their methodology and local projects are described in their EcoLogistics handbook, and they wanted a summarized and immersive digital version of this handbook.
Requirements
- Develop and design an interactive and immersive version of the ICLEI EcoLogistics handbook
- The design has to have its own identity, but the page has to be included within an existing Wordpress environment
- The design focus is on desktop sized screens, but has to work on mobile or tablet devices as well.
The design for the project comes from the great UX/UI designers at Puntoaparte and development of the project was done by Show ’n Tell Data.
Solutions
Navigation and Structure
The complete EcoLogistics handbook was eventually divided into 9 separate sections which can be navigated through by just scrolling down. A progress bar indicates where a reader is in the handbook and a section indicator on the right of the screen indicates which section a reader is seeing at that moment. Besides scrolling down, the user can also click on either of the section indicators to quickly move there.

To facilitate reading and make the digital version feel less like a long book a reader scrolls through, the different sections appear as they would in a slide show. This means that each section is always the height of the screen and the content is faded in and out as the reader scrolls down or up to the different sections.
Interactive Elements
In order to create a more enjoyable reading experience, almost all sections have an interactive element through them, either by selecting data or by given additional information on hovering over certain parts of the section.
Interactive illustrations
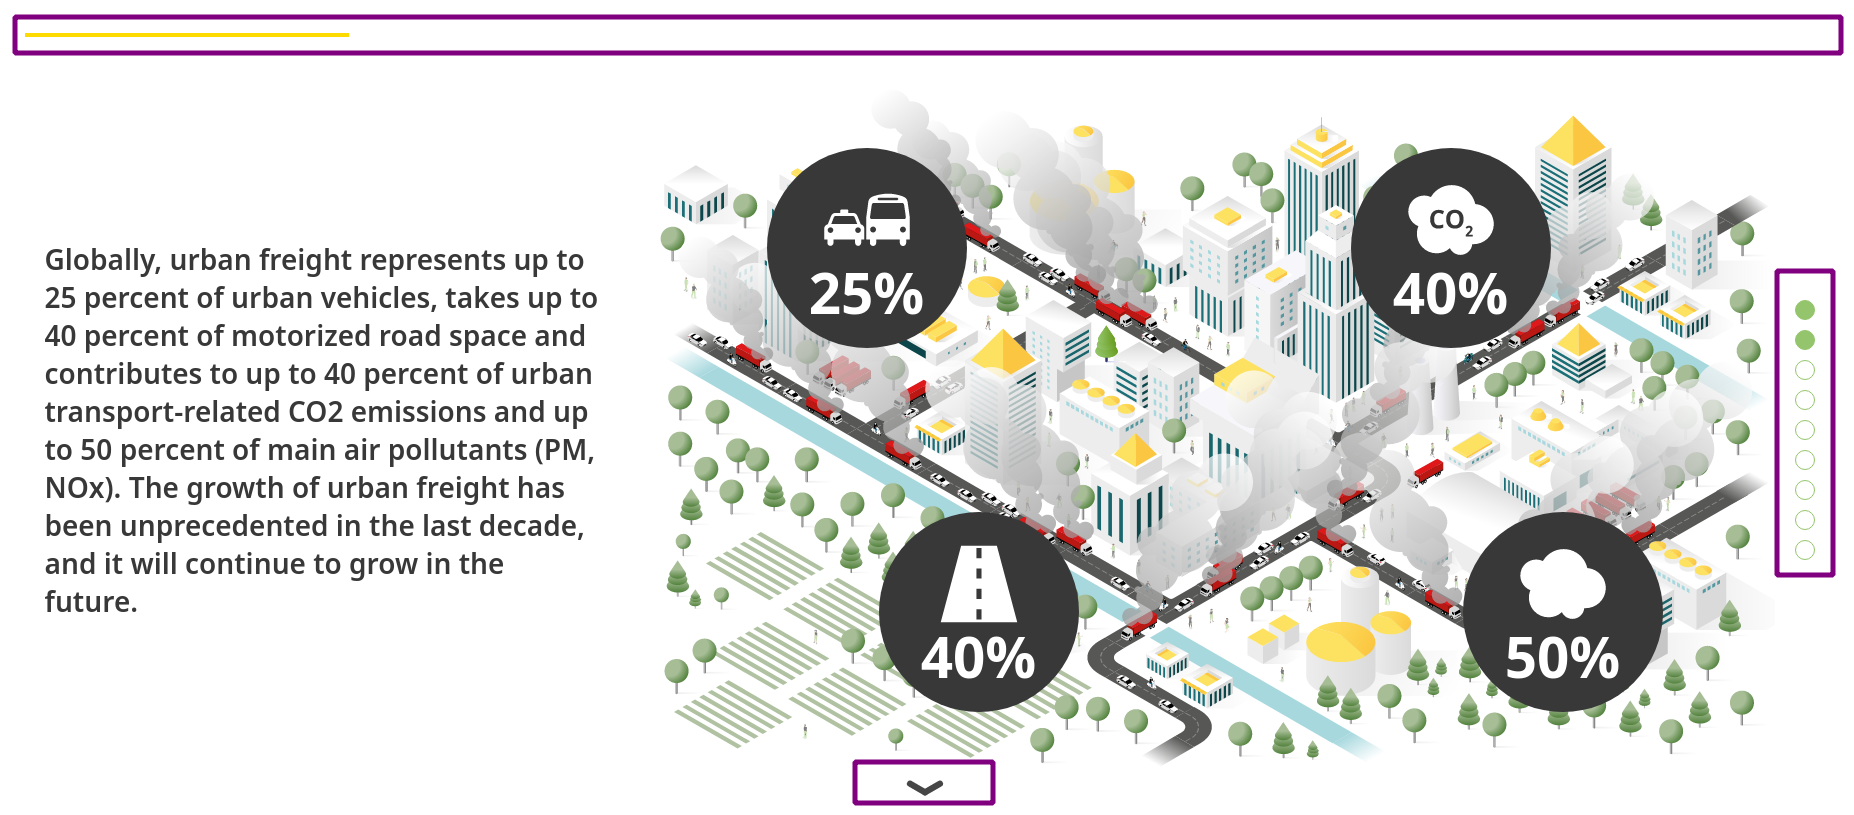
The EcoLogistics handbook contains some very branch specific concepts, so in order to help with the understanding of those concepts, we created interactive illustrations that would help explain all the different concepts used in the handbook.
Interactive map
Besides some specialized concepts, the handbook also contains some example projects around the world and what better way to show them than in an interactive map. In this case we decided to go with an interactive image of a map instead of loading an actual map. The specific design of the map would imply a lot of additional infrastructure in order to load it from a map server and the interactive image would be easier to maintain in the future than the additional infrastructure.
Responsive Design
For mobile versions of the EcoLogistics handbook we decided to simplify some of the hover interactions in order to make those work as well as slightly adjusting the design of certain elements to deal with the smaller screen size. However, most of the functionality that is available for desktops is also available on the smaller screen.
Editable for the future
Finally, although many or frequent changes were not expected for the handbook, we still wanted to make the content editable within the timeline and objectives of the project. Because the layout is very much customized and not easily recreated with standard Wordpress components or plugin components. We developed our own plugin that would load the required data from a json file. This way, ICLEI could still edit or add text, or even add additional sections if they wanted to, and we would still make sure that they would fit in the existing layout of the digital handbook.