Sdg Synergies App
Year: 2019
Design: PuntoAparte & Show 'n Tell Data
Technologies: PHP, MySQL, D3.js, Vue.js
Note: This project is in active development
The Stockholm Environment Institute (SEI) is an international non-profit research and policy organization tackling environmental and developmental challenges and one of their many projects revolves around the idea of synergies between the different Sustainable Development Goals (SDGs). The main point of it being, that the advancements in one particular goal or objective may have a positive (or negative) impact on the advancement in other goals.
Requirements
- To obtain data about the above mentioned interactions, the SEI organizes workshops in which experts score the interactions between SDG objectives as being positive, negative or neutral. Instead of having those experts fill out heaps of forms, the SEI wanted a more interactive and fun solution for experts to work with.
- One of the goals of the workshops is to show immediate results of the experts’ opinions, so the SEI needed an interactive visualization of the data for a particular workshop to be able to share the results with the experts participating.
- Finally, the researches at the SEI needed an easy and interactive way to analyze the results of the different workshops that were organized and have the possibility to download data for further analysis.
Solutions
Recollecting data
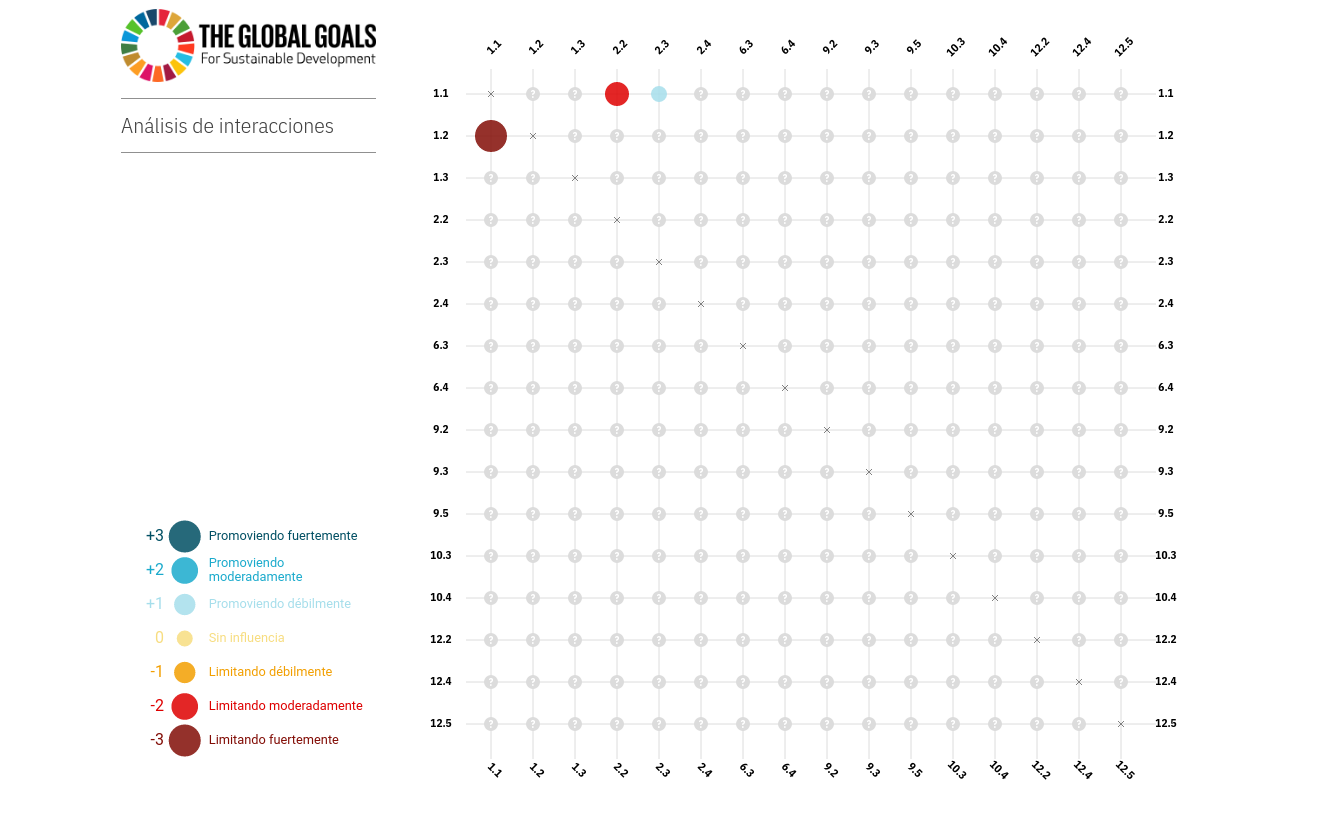
The first part of the solution, was to create an interactive form for the experts to use during the workshops. Thanks to some great design by PuntoAparte, the final interface for experts became a matrix showing all the interactions between the chosen SDG objective for a given workshop. Clicking on one of the interactions, the experts can proceed to give it a score and comment on their score and once they submit it their answers are stored in the database for later viewing and analysis.
 |
 |
| *The expert matrix | Scoring an interaction* |
Viewing results
After the scoring part of the workshops has ended, an immediate view of the results can be shown using the same matrix, but now with the averaged scores of all experts for all the interactions. The view is instantaneous and can be viewed during the scoring part of the workshop as well to show answers from the experts are incorporated in the final result.
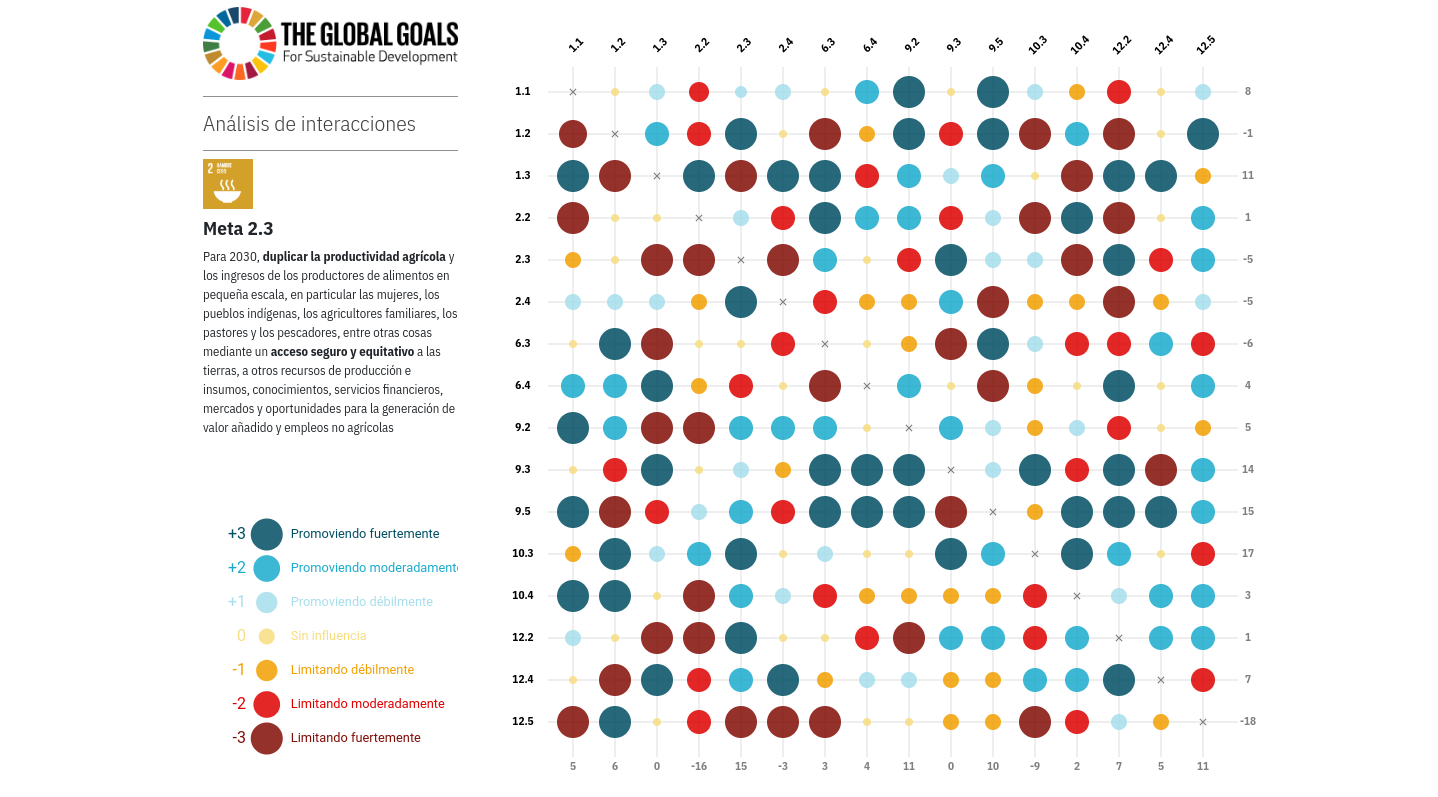 |
| The final results matrix |
If you want you can also go into detail and show the distribution of scores for one specific interaction in the matrix.
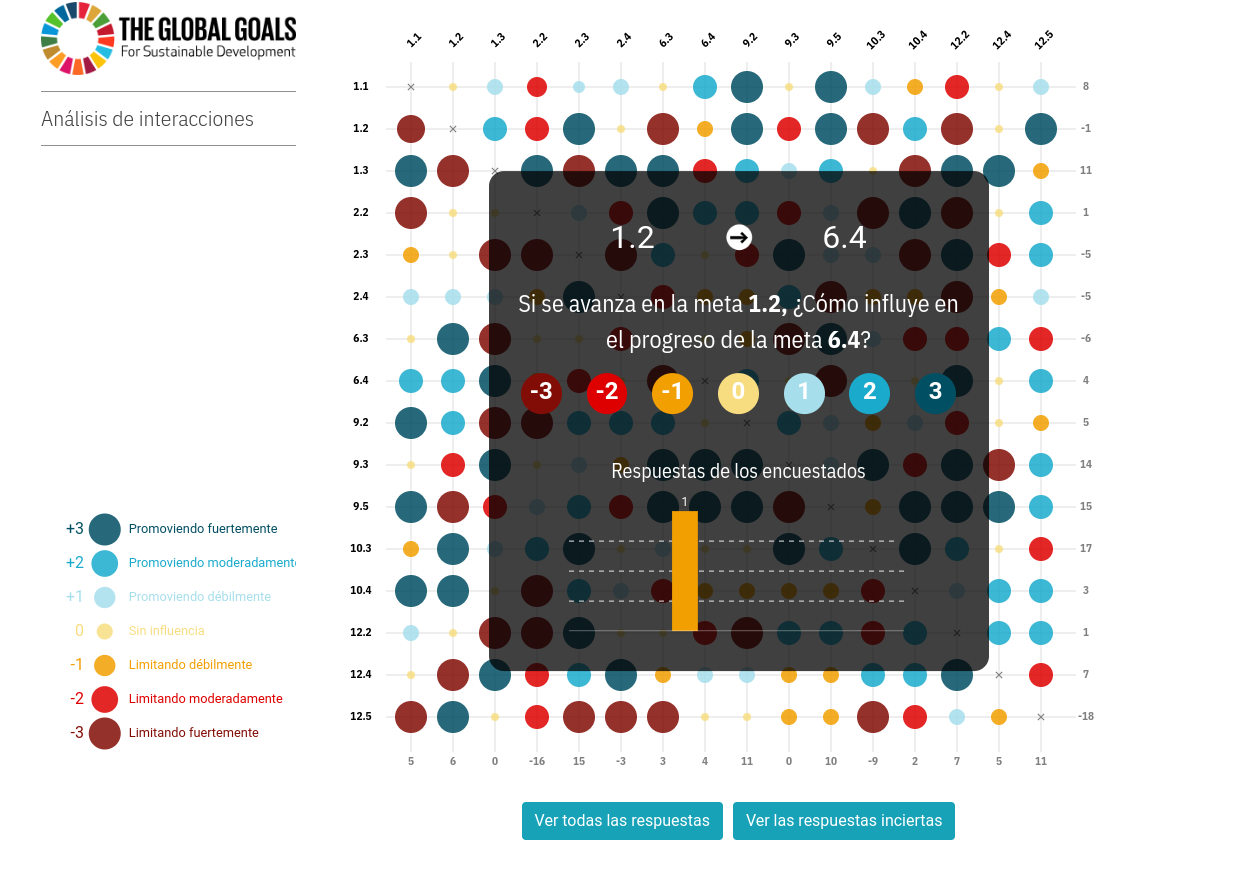 |
| Showing the result for one interaction |
Other view types
Besides the matrix which shows all interactions at the same, the organizers of a workshop also have the ability to view the results of one goal in relationship with all other goals in a radial diagram. This view, has the added options of filtering on the score size and reordering interactions by their score.
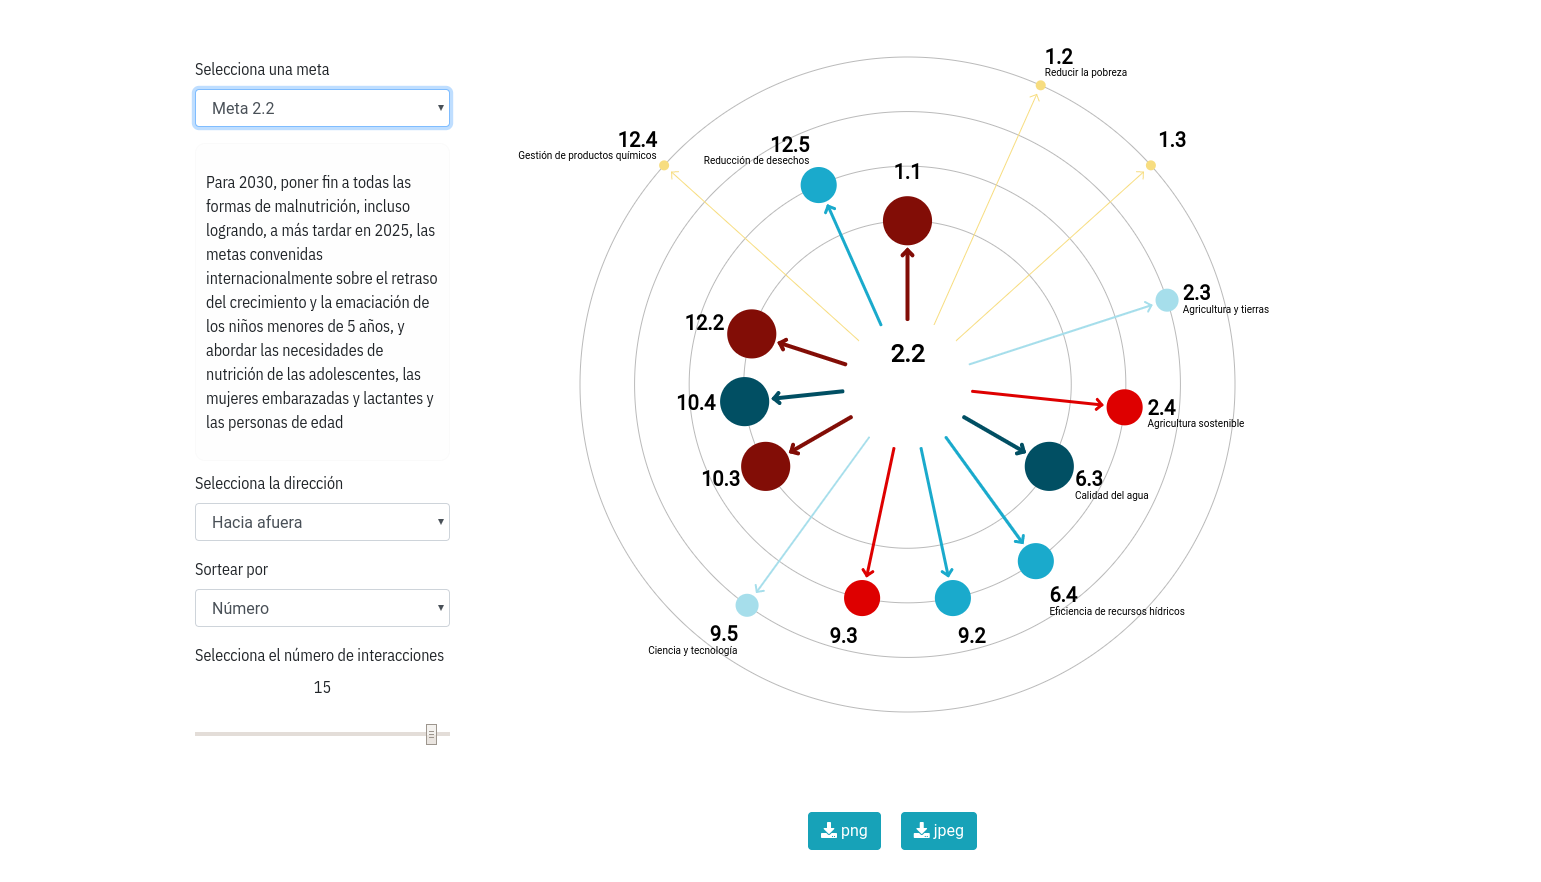 |
| A radial diagram of on SDG objective interacting with all others |
Another way of looking at the results is by looking at the network (graph) created by the interactions between SDG objectives. For this analysis I also created a network view which places the nodes with the largest interaction scores in the center and tries to give an overview of the most influential objectives.
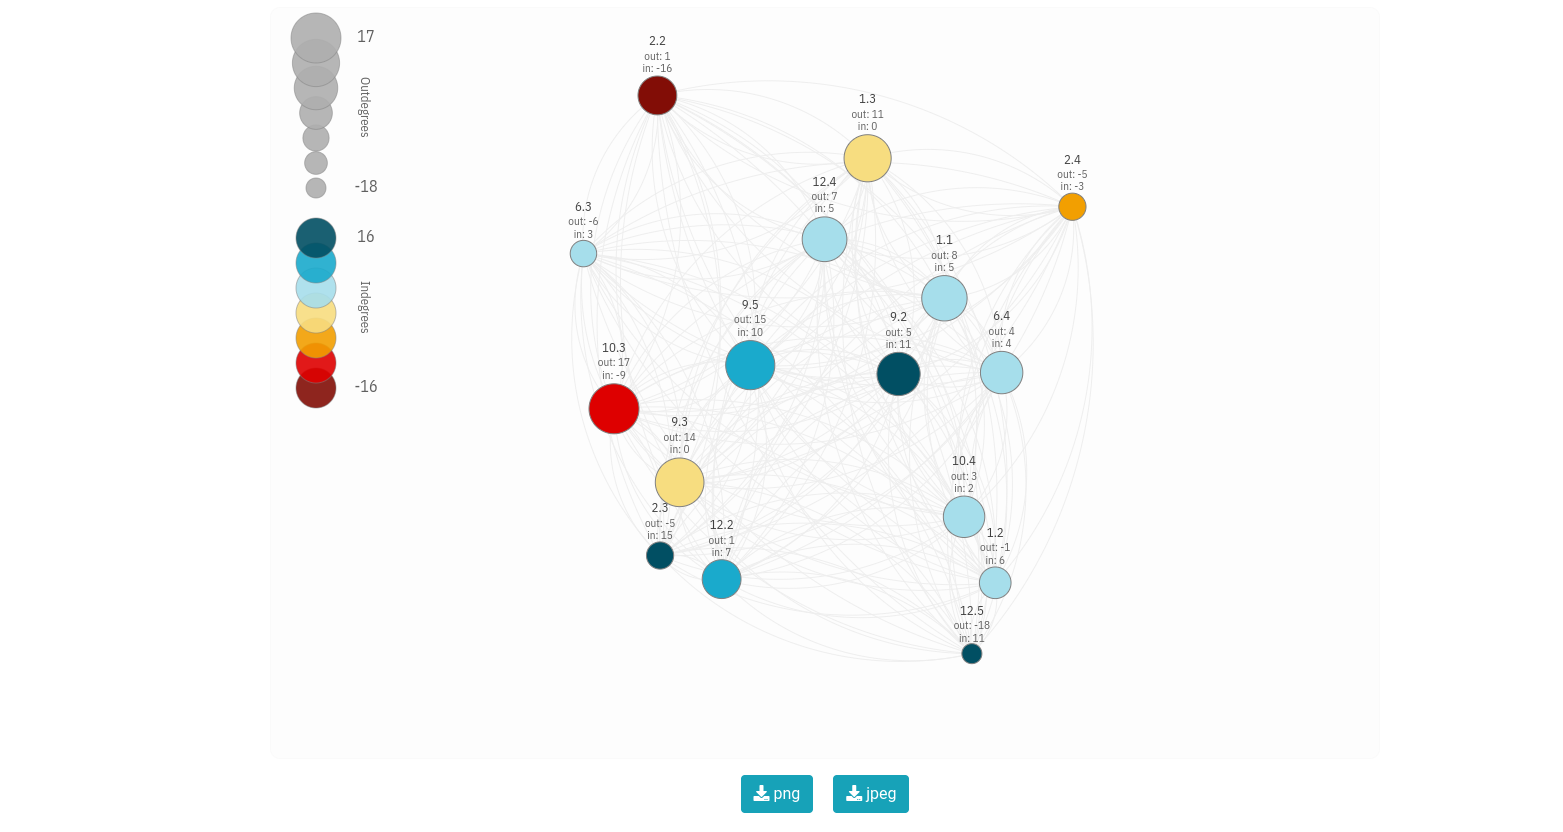 |
| A network view of the SDG objective interactions |
These visualizations give a very good initial overview of the interactions between goals as well as being pleasing to the eye (or at least I think). That’s also why all visualizations can be downloaded at a high resolution to be used in other documents.
Further analysis
While the visualizations give a good initial view of the interactions, for a more detailed analysis I also added the possibility to download the data for further analysis using statistical analysis programs like R, Python or Gephi.
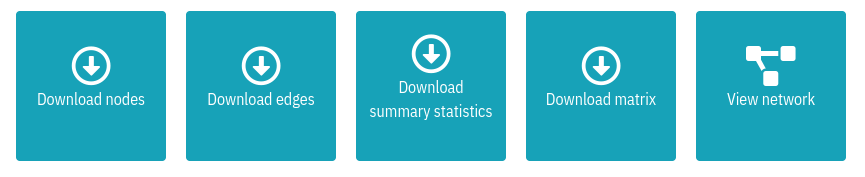 |
| The options for downloading the network data |
 |
| The options for viewing and downloading the interactions data |
Making it future-proof
Finally, all these options are great if you have just one workshop, but obviously the goal is to keep using this application as much as possible for all types of workshops. So, in order to make it a bit more future-proof, the application also has an administrative part where administrators can add and edit objectives (different from the ones defined for the SDGs).
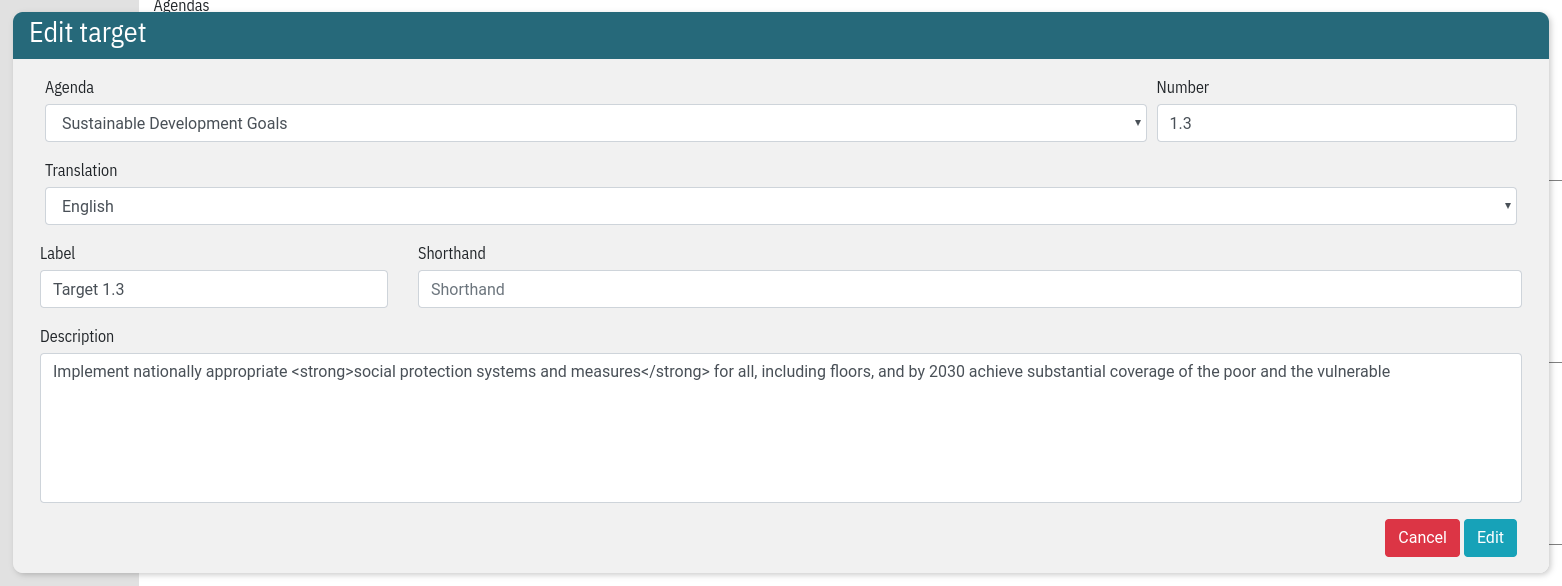 |
| Editing an objective |
After creating or editing objectives, these can then be linked to new workshops. All the view and download options are available for all the different workshops that are organized, making this an application where researchers can easily access the data they collected in a variety of different workshops all over the world.